Multifactor ANOVA
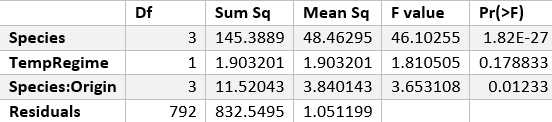
Figure 5. A multifactor ANOVA table showcasing the effects of species, temperature regime, and the interaction effects
The multifactor ANOVA indicates that there is a significant interaction between species and origin, and that the effect of species on coral weight is significant. Since the interaction effect is significant, the significance for the main effects is mostly irrelevant. This means that in order to better test for the effects of temperature regimes and species, it would be best to isolate one of those factors in a separate study. Nonetheless, neither will be isolated in real-world scenarios, so this study is relevant to showcase the effectiveness of coral in the ocean rather than in a coral nursery. Although the species is highly significant and has a large sum of squares and F-value, the effect remains irrelevant because there is an interaction effect, meaning that the temperature regime would need to be held constant in order to evaluate.
Species ANOVA with Blocking
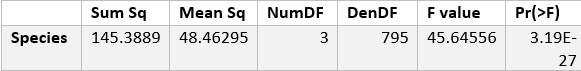
Figure 6. An ANOVA table of the species with the temperature regime blocked
In order to examine the effect of species without interference from temperature regime, an ANOVA was run with blocking. This ANOVA is highly significant with a large F-value, indicating that variance between is relatively high. Though the sum of squares is large compared to the interaction and the temperature regime, residuals remains the highest, meaning that there are other factors influencing the weight of coral.
Effect Size Statistics
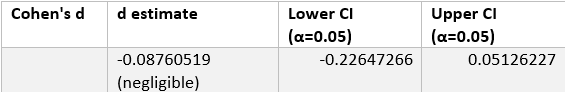
Figure 7. The results of the Cohen's d measurement
The package "effsize," was installed into R in order to calculate the Cohen's d statistic for temperature regimes, in order to ensure that the effect of temperature regimes were not a large factor. This value indicates that the differences observed due to temperature regimes was negligible.
Least Squares Means
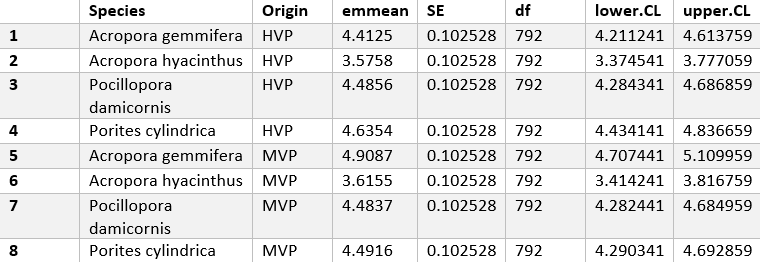
Figure 8. The least squares mean results table
|
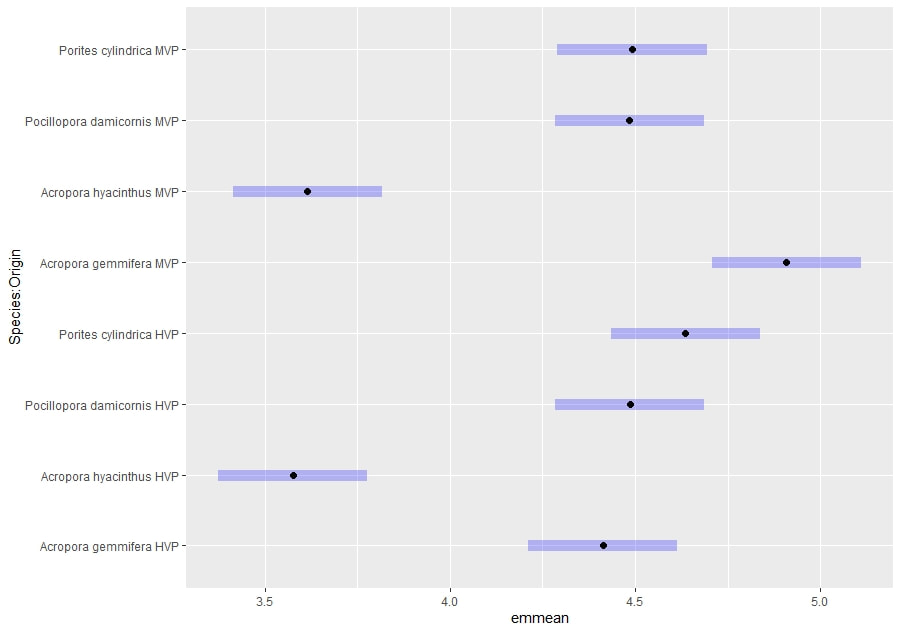
Figure 9. A plot of the least squares mean table
|
A least squares mean was run as a precursor to the pairwise comparisons test, as well as in order to visualize the upper and lower confidence intervals at 95%. From the graph in Figure 3, one can see that there is high amounts of variation between species when paired with temperature regime.
Pairwise Comparisons Test
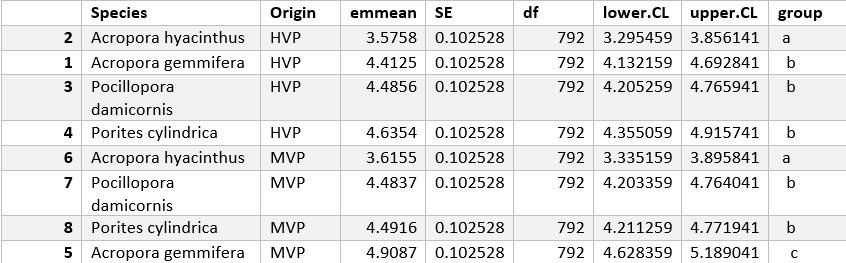
Figure 10. The results of the pairwise comparisons test
Pairwise comparisons were done using compact letter displays using sidak to adjust. This result gave us three groups which are statistically different from one another. In order to effectively plant therefore, one could look at the temperature regime (Origin), then choose to plant coral species that would put them in the b or c group.
