|
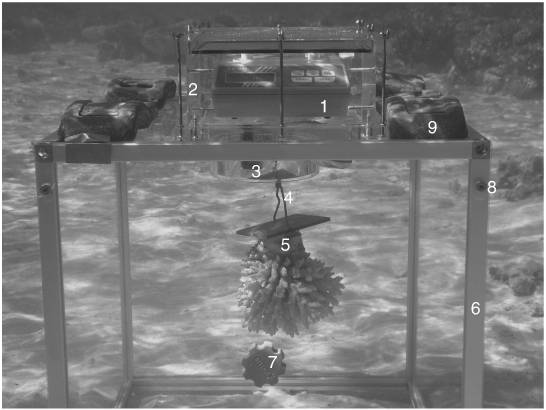
To properly measure the amount of growth each of the 4 coral species experienced once transplanted, we used a buoyancy weight measurement method. This method determines the weight of a coral propagule by measuring the amount of liquid it displaces when submerged in a container or in a submerged environment. 800 propagules were selected, with 200 from each species, all having initial weights under one gram prior to it being placed in the new sites. The selected propagules were adhered to concrete slabs which were then placed on the ocean floor at the two selected sites.
The sites consisted of two areas that experience different variations in early water temperatures. One sight, referred to as moderately variable pool (MVP), boasted water temperatures that varied moderately throughout the year, and only went above 29° C, 4% of the year. The second sight, referred to as highly variable pool, experienced high levels of temperature fluctuations throughout the year, and went above 29° C 8% of the year. To determine the fluctuation at these sites and determine their amount of variation we recorded the temperatures at each site. After the initial placement of the propagules, the specimens were left to grow for two years. In order to quantify the growth success of each of the coral species, we recorded the mean weights by species. The corals were remeasured at the end of the two year growing period. To do this each coral piece was again weighed using the buoyancy weight method. A specialized scale was placed on the ocean floor and each piece of coral weighed individually. Once all the propagules were weighed, a mean was taken for each of the species to determine the average growth. The other statistical analyses were done using R and excel. Boxplots were selected to compare the resulting size differences between the species on each of the sites. |

https://www.ncbi.nlm.nih.gov/core/lw/2.0/html/tileshop_pmc/tileshop_pmc_inline.htmltitle=Click%20on%20image%20to%20zoom&p=PMC3&id=3173722_gr2.jpg
|
References
Data manipulation and statistical analysis was done in Microsoft Excel and RGui. Data was based off of the study (Morikawa and Palumbi 2019), however the weight factor was converted in Excel by taking the mean weight in Australia and adding a random number between 0 and 1. After this was made, the data was converted into a standard data table format and was processed in R. The information and methodology on the coral measurements was adapted from (Herler and Dirnwöber 2011).
Temperatures were determines through average highs within the study cite. (https://mauritiusattractions.com/mauritius-sea-temperature-i-113.html)
Herler, J., & Dirnwöber, M. (2011). A simple technique for measuring buoyant weight increment of entire, transplanted coral colonies in the field. Journal of Experimental Marine Biology and Ecology, 407(2), 250-255. doi:10.1016/j.jembe.2011.06.022
Kuznetsova A, Brockhoff PB, Christensen RHB (2017). “lmerTest Package: Tests in Linear Mixed Effects Models.” Journal of Statistical Software, 82(13), 1–26. doi: 10.18637/jss.v082.i13.
Morikawa, M. K., & Palumbi, S. R. (2019). Using naturally occurring climate resilient corals to construct bleaching-resistant nurseries. Proceedings of the National Academy of Sciences, 116(21), 10586-10591.
R Core Team (2017). R: A language and environment for statistical computing. R Foundation for Statistical Computing, Vienna, Austria. URL https://www.R-project.org/.
Russell Lenth (2020). emmeans: Estimated Marginal Means, aka Least-Squares Means. R package version 1.5.2-1. https://CRAN.R-project.org/package=emmeans
Torchiano M (2020). _effsize: Efficient Effect Size Computation_. doi: 10.5281/zenodo.1480624 (URL: https://doi.org/10.5281/zenodo.1480624), R package version 0.8.1, <URL: https://CRAN.R-project.org/package=effsize>.
Wickham H (2016). ggplot2: Elegant Graphics for Data Analysis. Springer-Verlag New York. ISBN 978-3-319-24277-4, https://ggplot2.tidyverse.org.
