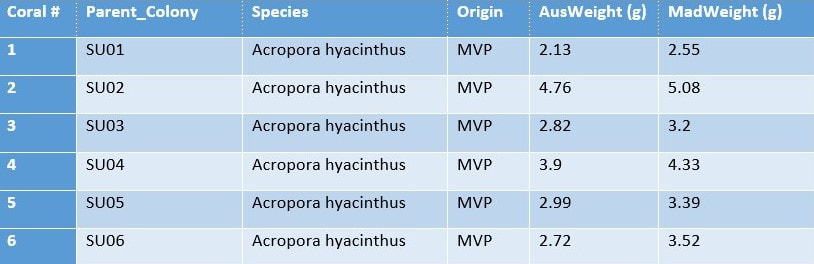
Figure 1: A sample of our standard data table, displaying the species, temperature regime (Origin), weight in Australia, and weight in Madagascar.
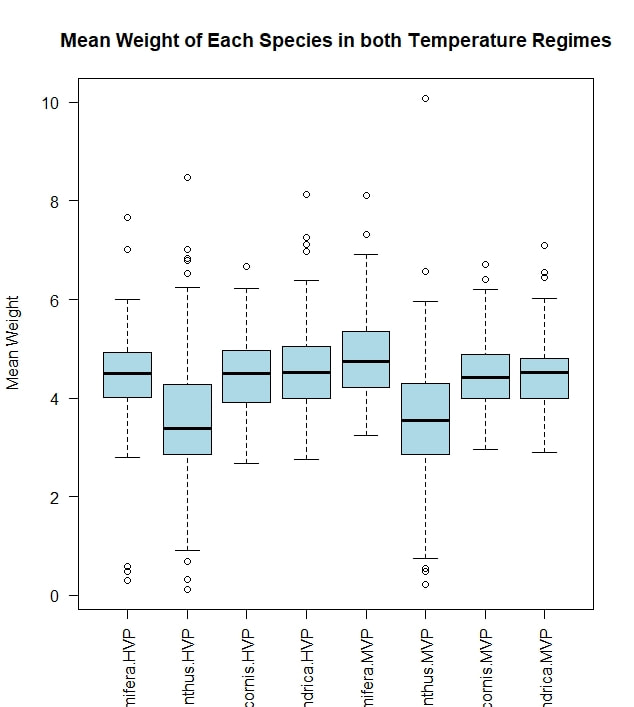
Figure 2. A boxplot displaying the mean weights in grams for each species under each temperature regime.

Figure 3. A boxplot of the average weight of the coral for each coral species studied.
|
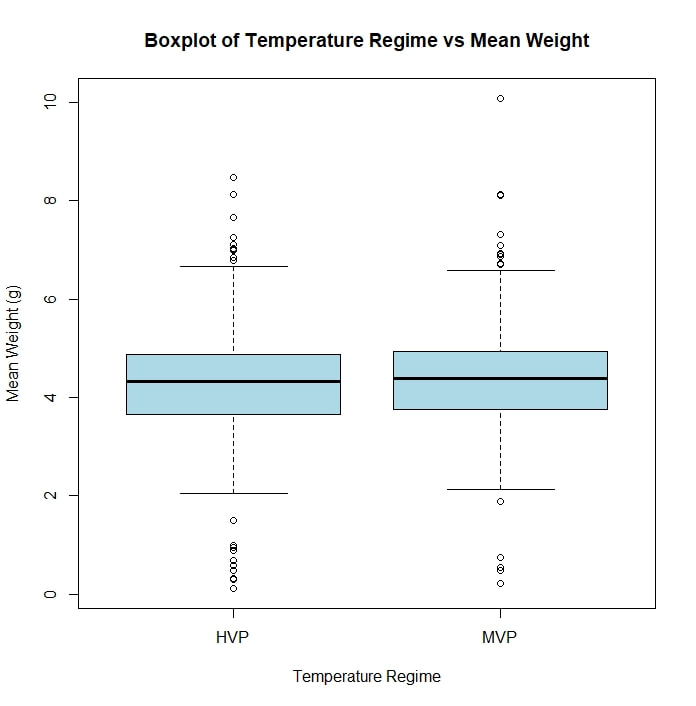
Figure 4. A boxplot of the average weight of coral in each of the temperature regimes.
|
Note: This data is simulated for the purposes of the REN R 480 course, and should not be considered accurate for any purposes outside of the course
